Sustainability
We operate responsibly every day to enable a safe and healthy future for people and communities globally. Our sustainability strategy helps us achieve our corporate purpose, positively impact society and deliver long-term business value.
We run to, not from, the world’s biggest health challenges
From finding solutions for some of the world’s most debilitating diseases, to getting our medicines and vaccines to those in need and building more effective health systems, we are always on a mission to create a better world.
Our approach
Operating responsibly is at the heart of our ability to deliver sustainable impact – driving long-term value for our company and society.
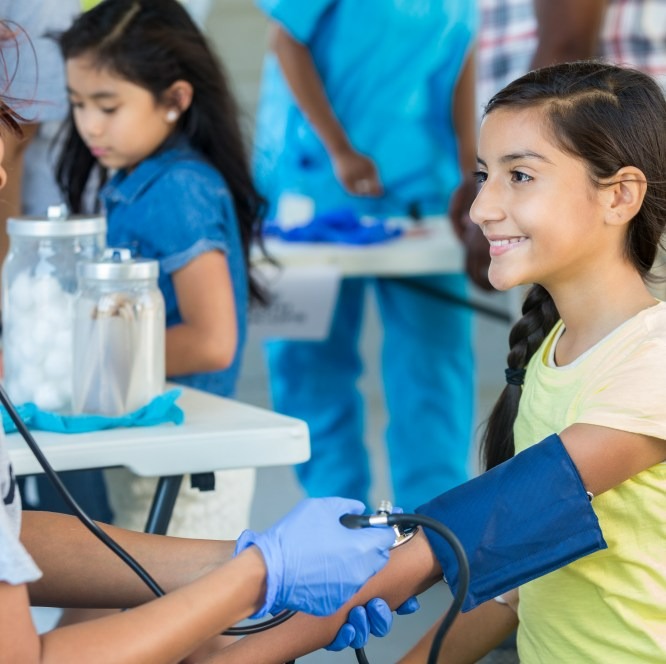
Access to innovative medicines and vaccines
In collaboration with key stakeholders, we work to ensure our science advances health care, and our products are accessible and affordable to those in need.
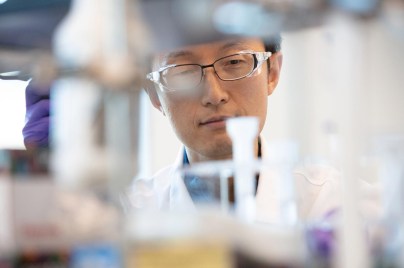
Using world-class research and science to save and improve lives
We make long-term investments in research & development and target diseases where we can make the greatest difference.
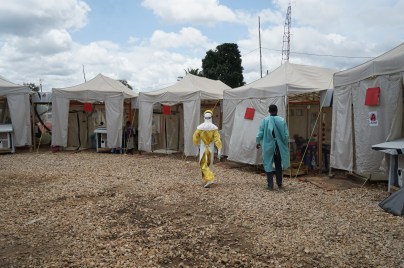
Researching infectious diseases and developing vaccines
We are committed to addressing the global public health burden of infectious diseases.
Working with partners who share our commitment
Through partnership, investment and endless invention, we seek to overcome barriers to providing a healthier future for all.
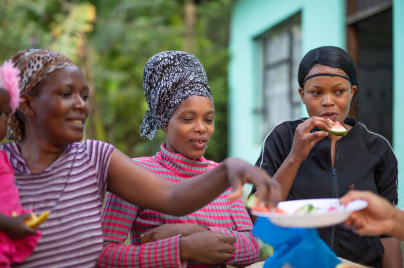
Our most valuable resource
Our company’s success is built on a culture that embraces different perspectives and values the contributions of each individual. We recognize that our competitiveness is strengthened by a diverse, skilled and engaged workforce.

Learning & development
As inventors, we invest in learning and development because our culture centers around curiosity.

A holistic approach to caring for our employees' well-being
Only when our employees feel their best, in all aspects of their lives, can they perform at their highest level.

Diversity & inclusion
The dynamic force driving everything we do.
A healthy planet is essential to the sustainability of our business
A healthy planet is essential to human health and the sustainability of our business, while also providing opportunities for product innovation and reducing cost and risk. Our Company has a long history of environmental stewardship and compliance, and we realize that our strategy and efforts need to continuously evolve in the face of a changing climate.
Drive efficient operations
Energy conservation, water use reduction, efficient use of raw materials and responsible waste management.

Design for environment
We deploy sustainability strategies to reduce environmental impact.
Reducing value chain impacts
We team up with our suppliers and customers to understand and minimize the life-cycle impacts of our products.
Operating with ethics, integrity and respect for human rights
We operate with the highest standards of ethics and integrity. By putting our ethics and values at the foundation of everything we do, we create an accountable culture that betters our company’s decision-making, adaptability and reliability.

Our values and standards
Our code of conduct is at the core of our character, helping us to maintain our reputation as a trustworthy company.

Human rights
We strive to detect and prevent labor and human rights abuses in our own operations and in our supply chain.

Ethical sales and marketing practices
We follow strict ethical sales and marketing practices in all our businesses.
Our impact by the numbers
number of people reached with our innovations in 2022
purchased electricity from renewable sources in 2022
spending with diverse Tier 1 and 2 suppliers globally in 2022

The stories beyond the report
There is real word impact behind our work. Dig deeper.


